
See Exactly What's Getting Done
Real-time dashboards, the Maintenance Effectiveness Index, technician and completion reports, and a full notification delivery audit — all exportable for compliance.
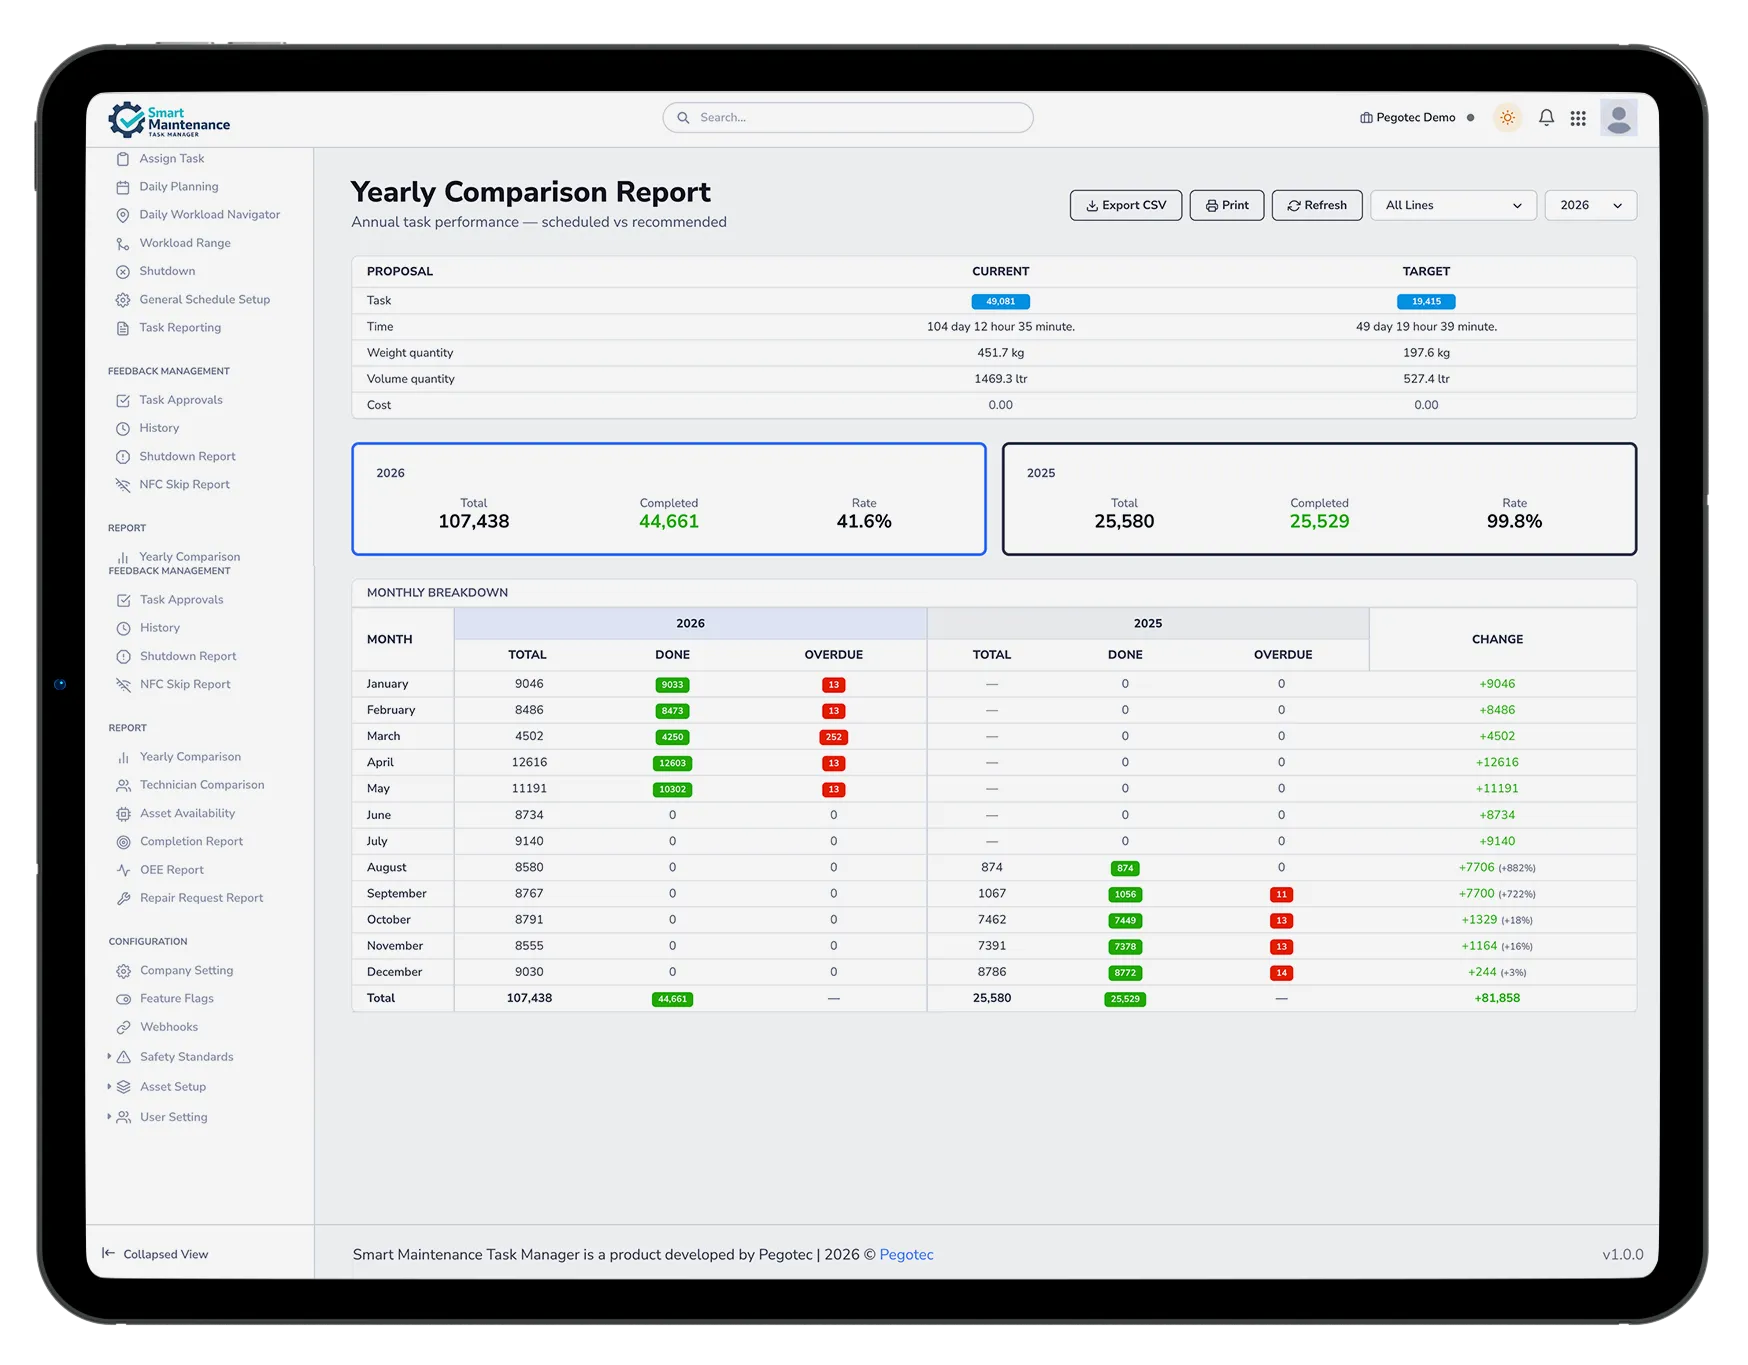
Real-Time Visibility Into Every Maintenance Activity
Smart Maintenance Task Manager gives managers and plant directors a real-time view of maintenance performance — without having to chase technicians or wait for manual reports.
The web dashboard shows task completion rates, overdue tasks, technician activity, and machine maintenance history. Export reports for compliance, management reviews, or internal audits.
- Task completion rate by production site
- Completion vs target report — actual % vs planned KPI per line/asset
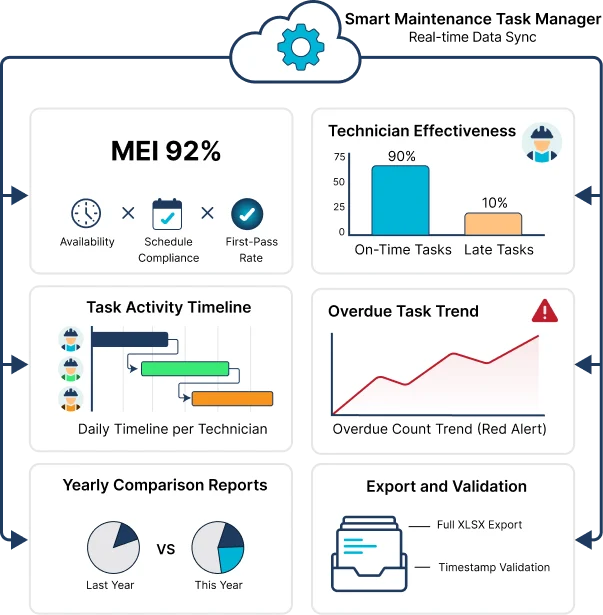
- Maintenance Effectiveness Index (MEI) — Availability × Schedule Compliance × First-Pass Rate, computed automatically from your maintenance data
- Overdue task count and trend
- Technician Comparison report — on-time vs late task counts across the team
- Technician Activity report — one technician’s tasks in a Day, Week, or Month, printable as a timesheet or audit record
- Machine maintenance history
- Flowchart view — daily timeline per technician
- Yearly reports with year-over-year comparison
- Full XLSX export (background job, download when ready)
- Server-side timestamp validation — detect tablet clock drift
A Single Score for How Your Maintenance Program Is Running
The Maintenance Effectiveness Index (MEI) is a maintenance-adapted effectiveness score combining equipment availability, schedule compliance, and first-pass quality — computed automatically from your maintenance data. No production output, cycle times, or unit counts required, and no extra data entry for operators. One number per line, asset, or site, easy to track over time.
Use it to spot which lines or sites are slipping, which are on plan, and which are running clean — without standing up a separate measurement system. The math: MEI = Availability × Schedule Compliance × First-Pass Rate.
What goes into the score
- Availability — equipment uptime calculated from logged shutdowns; hour-accurate when start & end times are recorded
- Schedule Compliance — scheduled maintenance completed vs due in the period
- First-Pass Rate — work completed without raising a repair request
A Printable Per-Person Work Record — for One Day, One Week, or One Month
Pick one technician and a single Day, Week, or Month period; get a complete record of every task they completed in that window. Each entry carries the task date, the full asset location (production line › asset › section › task point), the task type, on-time vs late status, time spent on the task, any readings the technician recorded (quantity, temperature, vibration, wear, pressure, current, time), and any remarks they left. A period summary at the top — tasks done, on-time, late, total time — plus a list of any repair requests raised in that window.
Each view prints on its own. Supervisors use it for a shift or week at a glance; managers and HR keep it as a defensible work record for appraisals; service businesses hand it to a client or auditor as proof of work. It complements the Technician Comparison report (on-time vs late counts across the whole team) by giving the per-person detail.
For each completed task
- Date, task type, full location (line › asset › section › task point)
- On-time vs late status
- Time spent on the task, plus a period total
- Readings: quantity, temperature, vibration, wear, pressure, current, time
- Remarks the technician left on the task
- Period summary: tasks done, on-time, late, total time
- Repair requests raised by the technician in the period
Prove Every Alert Reached Someone
Every reminder, escalation, and approval request is logged the moment it goes out — across every channel, with delivery and acknowledgement tracked end to end. When an auditor asks whether the right person was actually told, the answer is on one screen.
Full Delivery Ledger
Every notification, every channel — in-app, push, and email — with its delivery status recorded
Delivery Success Rates
See how reliably alerts are landing on each channel, so a silent failure can't hide
Acknowledgement SLAs
Track who acknowledged, who was late against the deadline, and what's still outstanding
Unacknowledged Alerts
Alerts that need sign-off and haven't been acknowledged surface at the top, at a glance
One click to a CSV
Export the full delivery and acknowledgement trail to CSV — filtered by date, channel, or status — for compliance reviews, safety reporting, or an external auditor. The audit view is available to administrators with the right permission, so the record stays in the right hands.
Know When a Counter Has Gone Quiet
Usage-based service intervals are only as reliable as the readings behind them. Two reports keep planners ahead of a stale counter instead of finding out from a missed service.
Stale-Meter Digest
Every counter has its own tolerance for going unread. A counter quiet beyond it is named to the people who can act — once when it goes quiet, then no more than weekly — with how many service intervals still rest on its last confirmed reading, and whether technicians tried and could not read it. A projection built on an old number is caught before it misleads a schedule.
Missed-Reading Report
When a scheduled reading round goes by without a number, the people who can act on it — those who manage counters or assign work — get one line in the daily digest naming the machine, the day it was due and who it was assigned to. Each missed round is reported once, and rounds closed without a single reading are listed separately, so the report stays worth reading.
Projected Next-Due
Every meter-based rule shows a projected due date computed from how fast the meter is actually moving, so the next service is visible before the reading crosses the line.
Stock That Moves When the Work Is Done
Lubricants and consumables are the one part of maintenance that spreadsheets never keep straight, because the number changes on the floor and the spreadsheet lives in the office. Smart Maintenance Task Manager books consumption from the task itself: when a technician records the quantity used on a lubrication task, the stock balance moves — no separate data entry, no reconciliation at month end.
Stock is held either as one inventory for the whole company or one per production site — your choice. Receipts, adjustments, and transfers between sites are all recorded, and every movement sits in an auditable ledger from which the balance can always be reconstructed.
- One inventory for the company, or one per production site
- Consumption booked automatically from the lubrication task
- Receipts, adjustments, and transfers between sites
- Every movement in an auditable ledger
- Low-stock alert when a balance crosses its reorder point — re-armed after the next receipt
- Balances always reconstructible from the ledger
Enabled per customer
Inventory is an optional module that Pegotec enables for your company on request. Everything else on this site is included in every subscription; inventory is the one add-on. It does not do purchasing: no purchase orders, order lists, or supplier management — it tracks what is on the shelf and what the work consumed, and tells you when to reorder.
Capabilities in Detail
Every capability in this area, with a one-line note on what it does.
See Every Feature in a Live Demo
Our team will walk you through the platform — web and mobile — tailored to your industry and maintenance workflows.